D30 Realized LTV: How to Calculate It from Cohorts (and Why D7 Lies)
How to read a cohort matrix, calculate D30 realized LTV correctly, and avoid the immature-cohort mistake that makes recent weeks look like a collapse.
Most LTV numbers in most decks are predictions dressed as facts. Realized LTV is different: it's money that arrived. It's smaller, it's later, and it's the only version you can safely divide your CPI by.
This is how to calculate it from a cohort matrix, which window to use, and the one mistake that makes every recent cohort look like a disaster.
Realized vs. predicted
Predicted LTV extrapolates a curve — early retention and revenue feed a model that projects where a cohort lands at D180 or D365. Useful for planning. Directionally right, precisely wrong, and it degrades fast when you change something about the funnel.
Realized LTV counts what a cohort has actually paid you as of day n. It cannot see the future, which is exactly why it can't flatter you.
Use predicted LTV to set annual budgets. Use realized LTV to decide which campaign gets money this week.
The formula
Realized LTV (Dn) = Revenue from the cohort within n days of first seen
                    ──────────────────────────────────────────────────
                    Number of users in the cohort
Two variants, and the difference matters more than people expect:
- LTV per customer — denominator is everyone in the cohort, payers and non-payers. This is the number you compare against CPI.
- LTV per paying customer — denominator is only those who paid. Useful for pricing and packaging. Useless for UA math, because you didn't buy only payers.
Mixing them is the fastest way to convince yourself a channel is profitable when it isn't. A cohort with $48 LTV per paying customer and a 4% payer rate has a $1.92 LTV per customer. If your CPI is $3.50, you're losing money at a number that looked great in the meeting.
Reading the matrix
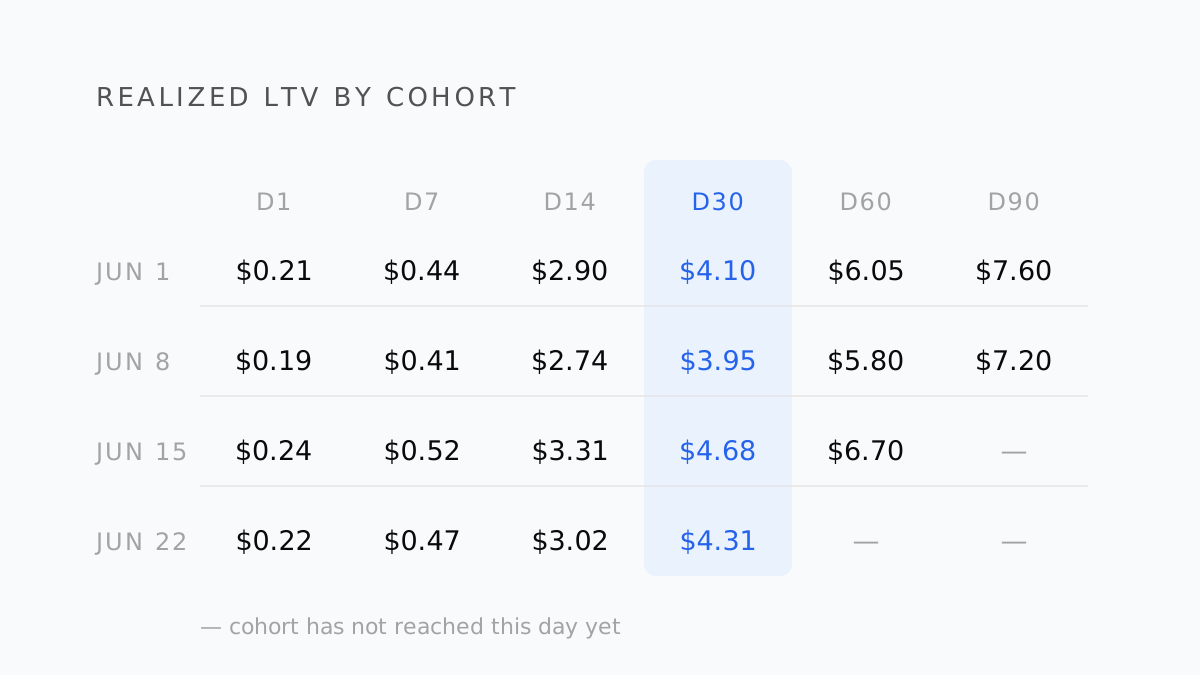
A cohort matrix puts acquisition week on the rows and days-since-install on the columns. Each cell is cumulative revenue per user for that cohort, at that age.
| Cohort | D1 | D7 | D14 | D30 | D60 | D90 |
|---|---|---|---|---|---|---|
| Jun 1 | $0.21 | $0.44 | $2.90 | $4.10 | $6.05 | $7.60 |
| Jun 8 | $0.19 | $0.41 | $2.74 | $3.95 | $5.80 | $7.20 |
| Jun 15 | $0.24 | $0.52 | $3.31 | $4.68 | $6.70 | — |
| Jun 22 | $0.22 | $0.47 | $3.02 | $4.31 | — | — |
| Jun 29 | $0.20 | $0.43 | $2.88 | — | — | — |
Read it two ways:
Down a column — cohort quality over time. The D30 column runs $4.10 → $3.95 → $4.68 → $4.31. That's normal variance with one good week, not a trend.
Across a row — the revenue curve. Notice the jump between D7 and D14: that's a 7-day trial converting. Before that boundary, the cohort looks nearly worthless.
Increase in realized LTV between D7 and D14 in the table above — the trial conversion boundary
Illustrative cohort, 7-day trial, monthly plan
Why D7 lies
Three separate reasons, and they compound:
The trial wall. A 7-day trial means D7 revenue is structurally near zero. Judging a channel on D7 in a trial-based app ranks channels by how many people didn't subscribe yet.
Annual plans distort early cells. One annual subscriber in a small cohort can double D1. That's not a better cohort, it's a lumpy one. Watch median as well as mean when cohorts are under a few thousand users.
Early signal doesn't rank the same as late signal. Channels that look identical at D7 routinely diverge 40% by D90 — brand and intent traffic converts later but renews better, broad social converts fast and churns.
If you must make a call before D30, use trial-start rate and D1 retention as leading indicators, and label them as such. Don't call them LTV.
The mistake everyone makes: immature cohorts
Look at the matrix again. The bottom-right is empty — the Jun 29 cohort is only 30 days old, so D60 doesn't exist yet.
The mistake is averaging the D30 column including a cohort that's only 20 days old. Its cell isn't low because the cohort is bad. It's low because it hasn't finished. Do this in a weekly report and every recent week looks like a collapse, every single week, forever.
Two rules:
- Never average across cohorts of different ages. Compare D30 to D30, only among cohorts that have reached day 30.
- Mark immature cohorts visually — dotted, greyed, or excluded. Whoever reads the chart at 8am will not remember the caveat.
This is also why a "last 30 days LTV" tile on a dashboard is close to meaningless. It's a blend of cohorts at every age, and it moves when your acquisition volume moves, not when your product does.
Setting the bar
D30 realized LTV per customer is only useful against something. Three ways to use it:
- Against CPI.
D30 LTV ÷ CPIis your D30 ROAS — the cohort-level version of the blended ROAS calculation. Under 1.0x is normal for subscription apps — you're buying a renewal stream, not a transaction. - Against payback target. If the business needs 6-month payback, find the day where cumulative LTV crosses CPI. If that day is past D180, the channel doesn't clear the bar no matter how good D30 looks.
- Against each other. The most reliable use. Absolute LTV depends on pricing and geo; the ranking of channels at a fixed D30 is what should move budget.
That third one is the practical one. You rarely need to know whether $4.31 is good. You need to know that TikTok is at $1.90 and Apple Search Ads is at $6.40, and that budget is currently split evenly.
- Realized LTV counts money that arrived; predicted LTV extrapolates. Use realized for weekly budget calls.
- LTV per customer and LTV per paying customer differ by your payer rate — only the first one is comparable to CPI.
- D7 is structurally near zero in trial-based apps; the trial boundary is where the curve actually starts.
- Never average a D30 column that includes cohorts younger than 30 days — it manufactures a fake decline every week.
- Ranking channels at a fixed D30 is more actionable than judging any absolute LTV number.
Doing this weekly without losing a day
The matrix is easy for one product and one revenue source. It gets hard when the cohort has to be split by acquisition network — because then the rows come from your ad platforms, the columns come from your subscription data, and the join is a manual export every Monday.
Roasy builds this view continuously: cohorts from your connected RevenueCat project, spend from every ad network, immature cohorts marked rather than silently averaged in. Same matrix, already assembled.
Related: how to calculate true ROAS from RevenueCat realized revenue, and what Adjust and RevenueCat each contribute.
Berk Aydın
Performance Marketing Lead at Roasy. Writes about ROAS, retention, and the messy economics of mobile UA.